 DirectToGrowth Co.
ROAS is the most screenshotted number in ecommerce and one of the least useful for running a business. It is a ratio built on attributed revenue, it ignores margin, it ignores returns, and it says nothing about whether you can make payroll. It is a great number to post in Slack after a good day. It is a terrible number to steer by.
ROAS screenshots are for Slack. Ad spend as a percentage of net revenue is for staying in business.
The number that actually predicts survival
The metric I put at the top of the dashboard is ad spend as a percentage of net revenue. Real dollars out the door, divided by real dollars in after discounts and returns. No attribution modeling, no platform-reported inflation. Just: of every dollar you actually kept, how many cents went to advertising?
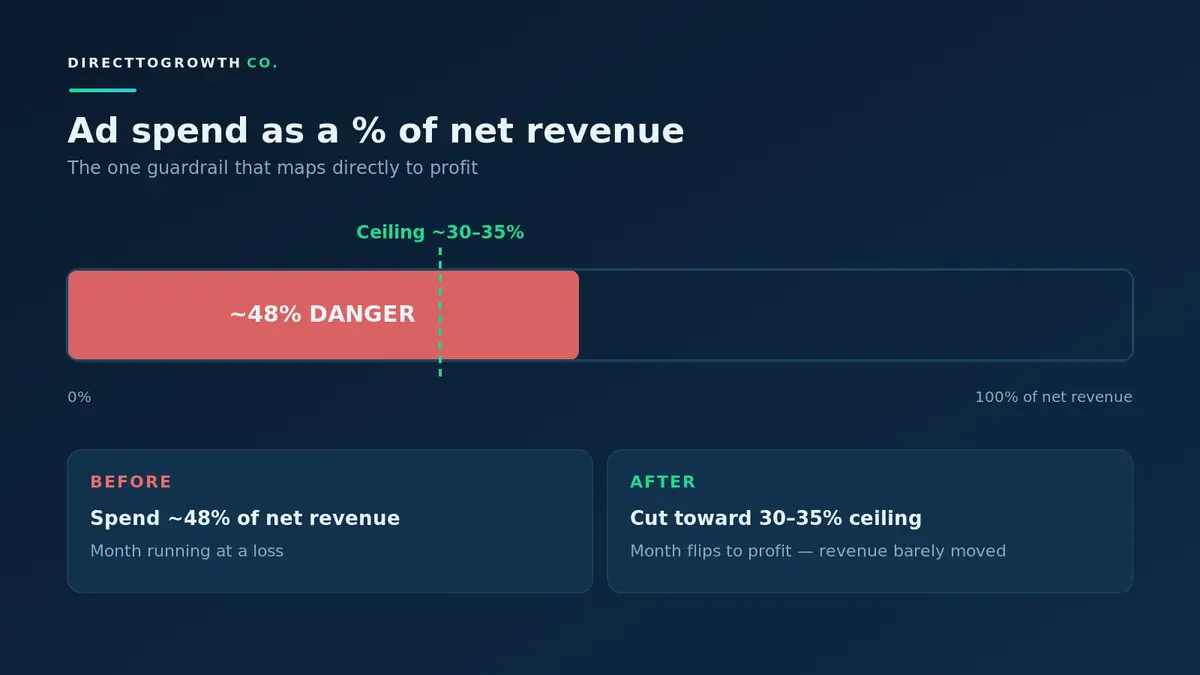
I picked this up on a cash-flow rescue. The brand looked fine on ROAS. But when we laid actual ad spend against actual net revenue, advertising had quietly crept up to nearly half of net revenue. That is not a growth engine. That is a business working for its ad platforms.
Why ROAS hides the damage
ROAS looks clean because it quietly excludes the two things that hurt you most. It is built on attributed revenue, which is usually gross — before discounts come off and before returns come back. So a channel can post a proud 4x while, underneath it, promo codes are shaving margin and a slice of those orders is boarding a return truck. The ratio never flinches. Ad spend as a percentage of net revenue flinches immediately, because net revenue already has discounts and returns baked out of it. You are comparing what you actually spent to what you actually kept — which is the only comparison that pays the bills.
The guardrail that flipped the month
We set a ceiling: ad spend should sit in roughly the 30 to 35 percent of net revenue range for this brand's economics. Then we cut toward it — the leak audit, killing the worst campaigns, pulling back where spend was buying revenue that did not clear margin. The month flipped from a loss to a profit. Revenue barely moved. The business got healthier because the ratio got healthier.
How to build the guardrail
This is not a data-science project. It is three habits done consistently:
Track actual dollars, not attributed ones. Use what left your bank account for ads and what net revenue actually landed after discounts and returns.
Express everything as a percentage of net revenue. Ad spend, fulfillment, discounts — each as a share of the money you kept, so the lines are comparable month to month.
Reconcile to the bank balance monthly. If your dashboard and your bank disagree, the bank wins. Always.
Once the ratio is on the wall, it changes conversations. Instead of celebrating a 4x ROAS day, you ask whether ad spend is drifting past your ceiling. Instead of arguing about attribution windows, you watch a single line that maps directly to profitability. The team stops optimizing for screenshots and starts optimizing for the business.
One refinement makes the ratio even more reliable: read it against a trailing four-week average, not just week-over-week. A single promo week will spike net revenue and make ad spend look artificially lean; the following week will do the reverse. Comparing each week to both the prior week and the trailing four-week average smooths out promo distortion and stops you from over-reacting to a calendar quirk. What you want to catch is drift — the slow creep of the ratio in the wrong direction — and drift only shows up clearly once you strip the noise out.
Why the ceiling matters more than the peak
A good ROAS day tells you a channel worked yesterday. A ceiling on ad spend as a percentage of net revenue tells you whether the whole machine is sustainable this month. One is a highlight reel. The other is a control system. You can grow on top of a control system. You cannot grow on top of a highlight reel.
Where you set the ceiling depends on your margins, and that is a feature, not a complication. A brand with fat gross margins can sustainably spend a larger share of net revenue on acquisition than a thin-margin brand can — so the right ceiling is the one that still leaves room for fulfillment, overhead, and profit after advertising takes its cut. Work backward from the contribution you need to keep, not from what a competitor claims to spend. The number that keeps you solvent is specific to your economics, and once you have it, it becomes the most important line on the dashboard.
Put the ratio at the top of your weekly review. Set a ceiling that fits your margins. Cut toward it when you drift. That single discipline will do more for your survival than any creative test in your backlog.