 DirectToGrowth Co.
A lot of creative testing produces more ads without making the next decision any clearer.
You launch a batch. One ad takes most of the spend. A few barely deliver. The next brief asks for another batch, with no real explanation of what should change. Repeat for a quarter and you have a bigger ad library, one tired winner, and a creative team guessing.
I used to run the textbook version of this: an ABO nursery that forced equal spend across new ads, then promote the winners into a CBO scaling campaign. In one account I work with, that structure was quietly spending a lot of money on tests that performed well below the evergreen campaign. So we changed it. We retired the nursery, consolidated evergreen creative into CBO, and let delivery go where it wanted. The structure is the least interesting part, though. What made it work was the loop we built around it: a repeatable way to turn performance data into production decisions.
That worked for this account at this stage. It is not the setup for every brand, and I will come back to where separate budgets still earn their place.
Tag the things you can actually act on
Every ad in the account carries roughly twenty to thirty tags. The product shown. The angle: problem–solution, founder story, us-versus-them, education. The format: video, static, UGC, comparison. Who is in it, including the creator’s gender. Hook type. Offer or no offer.
None of that is for reporting. It is there to answer one practical question at the end of the week: what should the team make more of?
A product comparison video and a founder story might sell the same product, but they tell you different things when one of them works. And the useful finding is usually a combination rather than a single tag. The product, the creator and the angle, working together, is a brief. “Video does well” is not.
Look at delivery and new-customer returns together
The weekly review starts with two numbers per tag and per combination of tags: how much spend it received, and the median net-new-customer ROAS of the ads inside it, compared with the account median.
Meaningful spend first. A group that got $40 over the week tells you nothing, however good the ratio looks. I use a directional threshold, $500 in that account as an example, and it moves with the scale and economics of the business. It is not a rule.
Then returns. I use the median rather than the average because one runaway ad will flatter an average and hide the fact that everything else in the group is mediocre. And I benchmark against the account median, not against last month or against a target, because the question is relative: of all the things we could make more of, which ones are beating the rest?
The one non-negotiable is attribution consistency. Seven-day click, seven-day click plus one-day engaged view, or the attribution tool’s model: I do not much mind which, but it has to be the same model for every group in the comparison. Switch models halfway and the ranking means nothing.
A caveat I keep repeating to my own team: these are patterns that inform the next brief. They do not prove that a female creator or an us-versus-them angle caused the result. We act on them because they are the best information we have, not because they are proof.
Where the opportunities hide
Two kinds of finding come out of this.
The first is a winning combination. One product variant, a female creator, an us-versus-them angle, in video, landing hard with women in the US aged 35 to 54. That is the level of detail a brief needs, because an editor can make six more of that.
The second is more valuable and easier to miss: an efficient cohort that is barely getting any spend. In one account, men aged 25 to 34 in the US were buying at a clearly better new-customer ROAS than the account median, off one specific problem angle, and that cohort was attributable to roughly 3% of weekly spend. Nobody had decided that. Delivery had just drifted to the big winner, which spoke to someone else.
So the question changed from “what’s working?” to “how do we spend more on that cohort without forcing it?” The answer was production, not budget rules: more creative built around that angle, launched into the same evergreen campaign. Over the following weeks the cohort’s share of spend grew to about 11%, its stronger returns held as delivery expanded, and the account’s overall efficiency improved alongside it. I will not claim that one change caused the whole improvement, because other things were moving in the account too. But it is the clearest example I have of the loop doing its job.
| What you see | What it usually means | What the brief says |
|---|---|---|
| One ad has 60% of spend, everything else starves | Delivery concentrating on a single winner; fatigue risk | Build variations of its tags, not clones of the ad |
| A tag combination with meaningful spend and above-median returns | A pattern worth more volume | Three to six new executions inside that combination |
| A cohort with strong returns and a tiny share of spend | An audience the creative is not speaking to | New creative built around what that cohort responds to |
| Few groups above the median, winners aging | The account needs new ideas, not more iterations | Shift the mix toward genuinely new concepts |
What still gets its own budget
Consolidating into CBO does not mean everything competes in one pool.
A materially new proposition, a new audience or positioning that could drag the evergreen campaign down while it finds its feet, gets its own campaign with ad-set budgets. So does anything time-bound: a Black Friday offer, a limited launch, a promotion that does not belong in a top-of-funnel evergreen campaign.
Creator licensing is the other case. If we have thirty-day usage rights on a big creator’s assets, the fixed cost is already spent and the window is short. I will force delivery on those assets for the window rather than let CBO decide they can wait. That is a budgeting decision about a constraint, not a belief that sunk costs justify bad spend.
How much of the mix should be new?
It depends on the health of the account, and I mean that literally.
When the account is strong, there are several productive angles and performance is inside the guardrails I agreed with finance, most of the week’s launches build on what is working, and roughly 10% go to entirely new concepts. Enough to keep hedging; not enough to dilute the thing that pays the bills.
When the account is inefficient and there are few winners to develop, iteration is just rearranging the same mediocre ads. Then the new-concept share goes to 40 or 50%. Those are working allocations from accounts I have run, not a formula, and a strong idea from someone on the team with real conviction can override either number.
The review ends in briefs, not a dashboard
The whole point of the weekly meeting is that it finishes with a production plan the strategists and editors can execute.
We go through the dimensions carrying a high share of spend and above-median new-customer returns. We count how many ads have saturated and need replacing. We decide how much fresh creative the account needs that week. If the answer is fifty launches, fifty is an example rather than a target, those fifty get allocated across the promising combinations, with an explicit share reserved for new concepts, and the brief says what should stay constant and what should change.
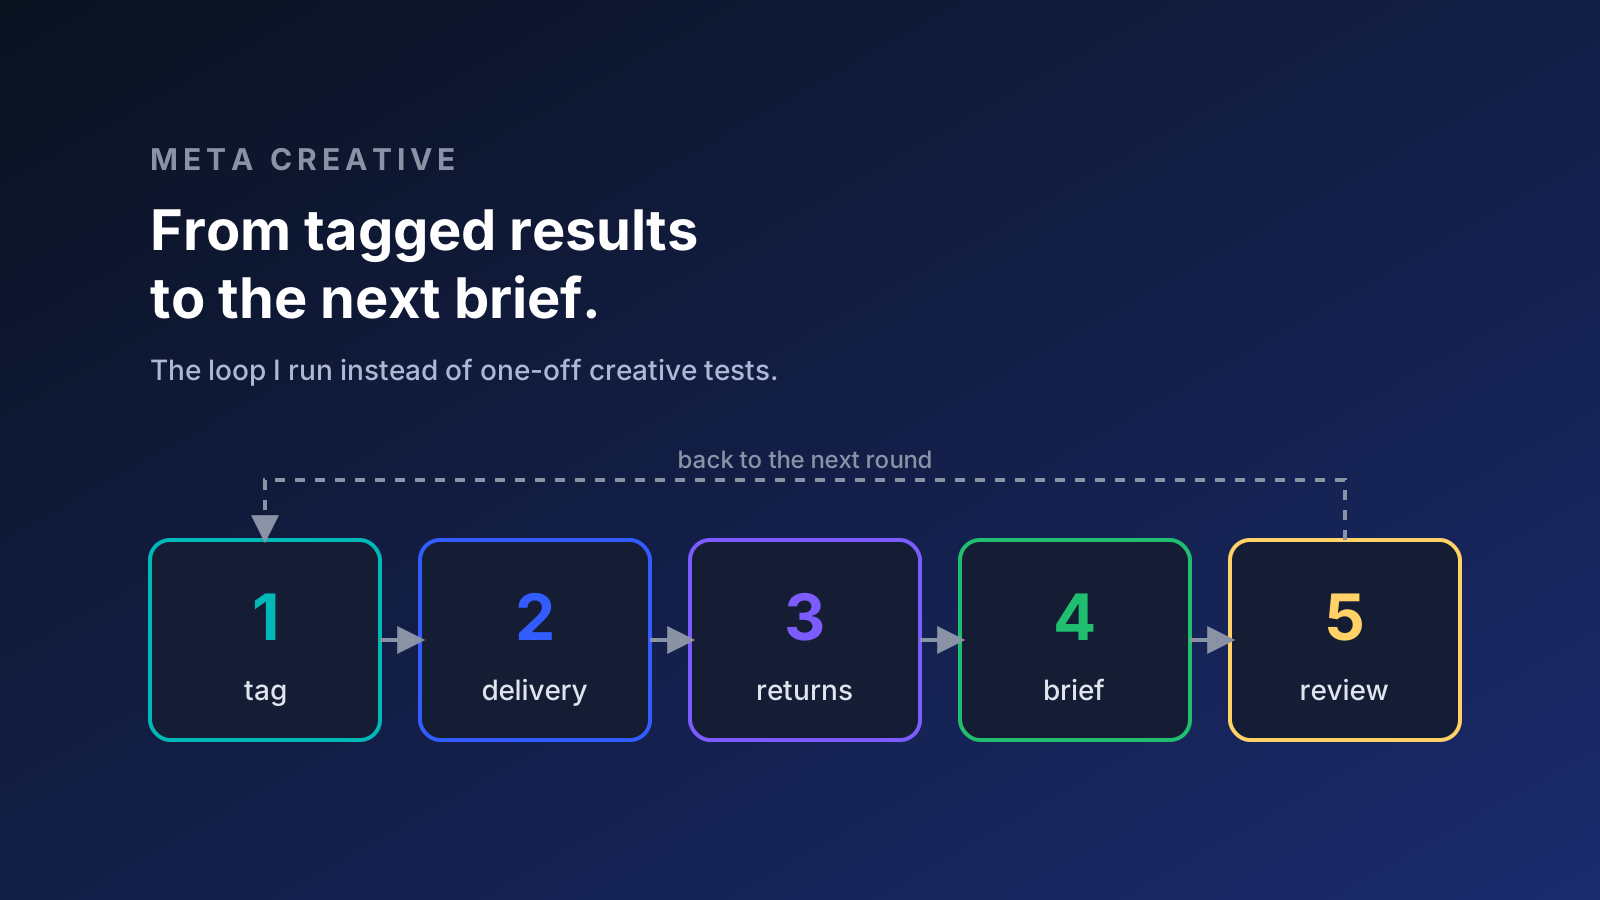
Then the next week’s results feed the next review. That is the loop. Each round has a reason behind it, and we can say what we are building on, what we are exploring, and what evidence would change the next brief.
Fatigue, and second lives
I look for a consistent decline across several windows at once: last three days, last seven, last fourteen, usually excluding the most recent two days so attribution lag does not fake a collapse. When the decline is persistent, often with rising frequency, and the ad has meaningful spend behind it, it triggers a media-buying review and usually a pause. That makes room for new ads to get picked up, which is the other reason the loop needs a steady supply of them.
Pausing is not discarding. Some former winners come back after roughly three weeks of rest, relaunched with their comments intact. Some do not. The break is a reason to retest, not a guarantee.
What I would tell a CEO reading this
If your Meta spend is large and your creative process is “make more ads,” you are paying for volume without buying information. The fix is not a new campaign structure, although you may need one. It is a weekly loop with tags you can act on, a consistent way of judging returns, and a brief that comes out the other side with reasons attached. The in-platform numbers will look messy for a while. Blended new-customer CAC and new-customer volume are the numbers that tell you whether it worked.
FAQ
Should every D2C brand move Meta creative testing from ABO into CBO?
No. Consolidating evergreen creative into CBO worked in one account where the ABO nursery was forcing spend onto weak tests. A materially new proposition, a time-bound promotion or a creator deal with short usage rights can still justify a separate campaign with ad-set budgets. Decide per account, and judge the change on blended new-customer CAC rather than in-platform ROAS.
How many tags does each Meta ad need?
In the account described here, roughly twenty to thirty: product shown, angle, format, hook, offer, and creator characteristics such as gender. The number matters less than the rule behind it: only tag things the team can act on in the next brief.
Why compare median new-customer ROAS to the account median?
The median stops one runaway ad from flattering a whole group, and the account median makes the comparison relative: which combinations are beating the rest of the account right now. Use the same attribution model for every group, or the ranking is meaningless.
How do you know when a Meta ad is fatigued?
A consistent decline across the three-, seven- and fourteen-day windows, usually excluding the latest two days, often with rising frequency, on an ad with meaningful spend. That triggers a review and usually a pause. Some former winners work again after about three weeks of rest.
What share of new creative should be completely new concepts?
In a healthy account with several productive angles, roughly 10% of weekly launches. In an inefficient account with few winners, closer to 40 to 50%. These are working allocations from real accounts, not fixed rules.