 DirectToGrowth Co.
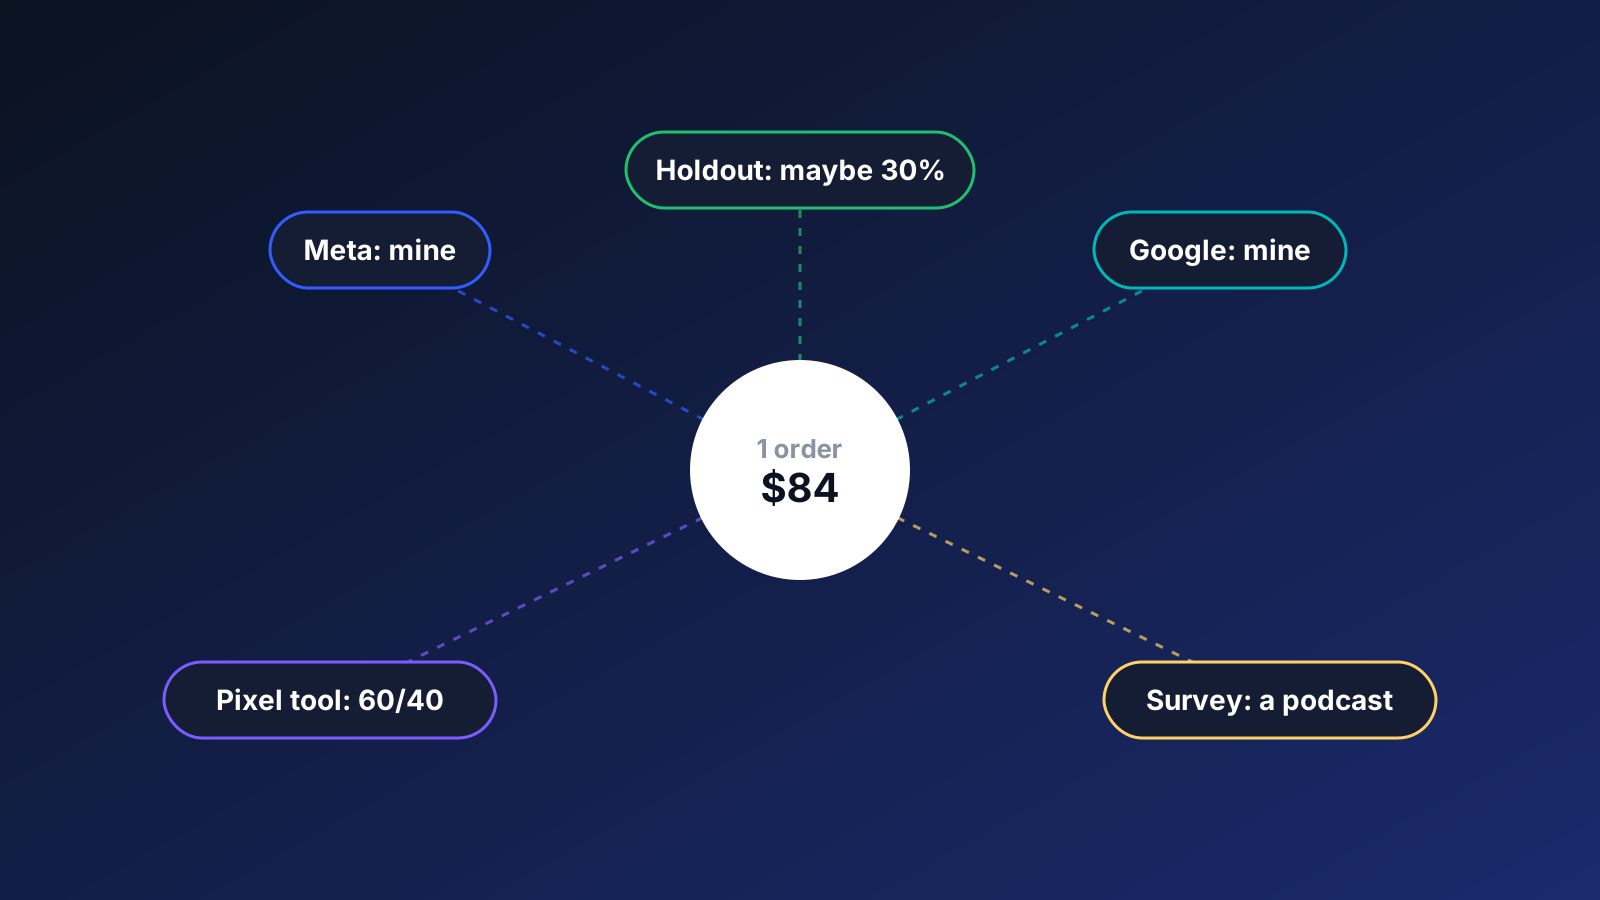
Ask five tools who drove last Tuesday's sales and you get five answers. Meta says Meta. Google says Google. The attribution tool says something in between. The post-purchase survey says a podcast. Add them up and you have apparently sold 1.6x what Shopify recorded.
None of them are lying. Each one is giving you an opinion, built on its own rules about what counts as "caused." The mistake I see most often is buying an attribution tool and then treating its opinion as the scoreboard. In one account I have watched Meta's in-console ROAS look worse for weeks while blended new-customer CAC fell and new-customer volume grew. The console was right about clicks and wrong about the business. Used well, each view is a consistent trajectory, not the exact output of a channel. The real job is deciding which opinion gets to make which decision.
You're not buying data. You're buying a point of view on your data. Pick the ones whose point of view you understand.
The six options, from fast to closest to cause
| Method | Good at | Watch out for |
|---|---|---|
| Platform reporting Meta, Google, TikTok | Free, real time, the numbers the algorithm optimizes on. | Every platform grades its own homework. Overlap means the totals rarely add up. |
| GA4 | Free, cross-channel, consistent rules. | Click-based. Underweights upper funnel and anything seen but not clicked. Consent gaps. |
| MTA pixel tools Triple Whale, Northbeam | One daily view across channels. First-party pixel. Fast to act on. | Still correlational. View credit is modeled. Easy to treat as gospel. |
| Post-purchase survey Fairing, KnoCommerce | Catches word of mouth, podcasts, creators — the stuff pixels miss. | Memory is fuzzy. People credit the last thing they remember. |
| MMM Robyn, Meridian, Recast | Top-down, privacy-proof, sees offline and brand effects. | Needs a lot of history and spend variation. Weekly or monthly, not daily. |
| Holdout / geo test | The closest thing to cause and effect you can buy. | Costs real spend. Needs volume. One answer per test, not a dashboard. |
What I actually recommend
Not one tool. Three layers, each with a different job, and each with a decision it is allowed to make.
Daily, to steer. Platform data or the MTA tool, used to move budget between ads and ad sets. Directionally useful. One rule: seven-day click, click plus engaged view, or the tool's own model, I do not much mind which, but it has to be the same model for every group in the comparison or the ranking means nothing. This layer does not decide whether a channel works; the more channels you run, the less of that question it can see.
Weekly, to sanity check. Total ad spend as a percentage of net revenue, blended new-customer CAC, and the survey responses. If the dashboard says a channel is flying and the blended numbers did not move, the blended numbers get the heavier weight and the gap is the week's question. They have blind spots too, but they are the ones finance will ask about.
Quarterly, to settle arguments. One holdout or geo uplift test on the biggest open question, or an MMM refresh once there is enough history. This is the layer I trust most on whether a channel deserves its budget at all, and the one best placed to see spend that works without a click: a connected TV flight, a podcast read, an educational ad someone remembered three weeks later. A pixel-based view, Triple Whale, Northbeam or Polar included, is built around your own site, so most of that is missing or only partly represented, as is the Meta ad that sends someone to buy on Amazon. For those channels I back into the answer with geo uplift studies and incremental brand search rather than waiting for the pixel to notice.
When a dedicated attribution tool is worth it
- You're spending across enough paid channels, usually three or more, that the overlap between them is a real question.
- Someone on the team will reallocate budget from it every week, not just report it.
- You've agreed upfront which attribution window and model you'll use, and you won't change it when the numbers look bad.
If you are mostly on one channel, I would usually skip it; the complexity it untangles is not there yet. Platform data, a survey and your blended numbers will get you 90% of the way for a fraction of the cost.
What I would tell a CEO: decide which opinion gets to make which decision, write it down once next to the guardrails you agreed with finance, and the Monday meeting gets a lot shorter.
FAQ
Which attribution tool is the most accurate?
None of them is the truth. Each is an opinion built on its own rules, so I pick the view I understand, keep its model fixed and read it as a trajectory. For whether a channel adds customers at all, a holdout or geo test gets closest.
Do I need an attribution tool if I only advertise on Meta?
Usually not. A brand on mostly one channel has a simpler measurement problem: platform reporting under one fixed window, a survey and blended new-customer CAC cover most of it. The tool earns its fee once several paid channels overlap and sales happen off-site.
Can attribution tools see a Meta ad that leads to a sale on Amazon?
In my experience that effect is missing or only partly represented in a pixel-based view, because the sale never touches your site. I read it through geo uplift tests, incremental brand search and total new-customer volume instead.