 DirectToGrowth Co.
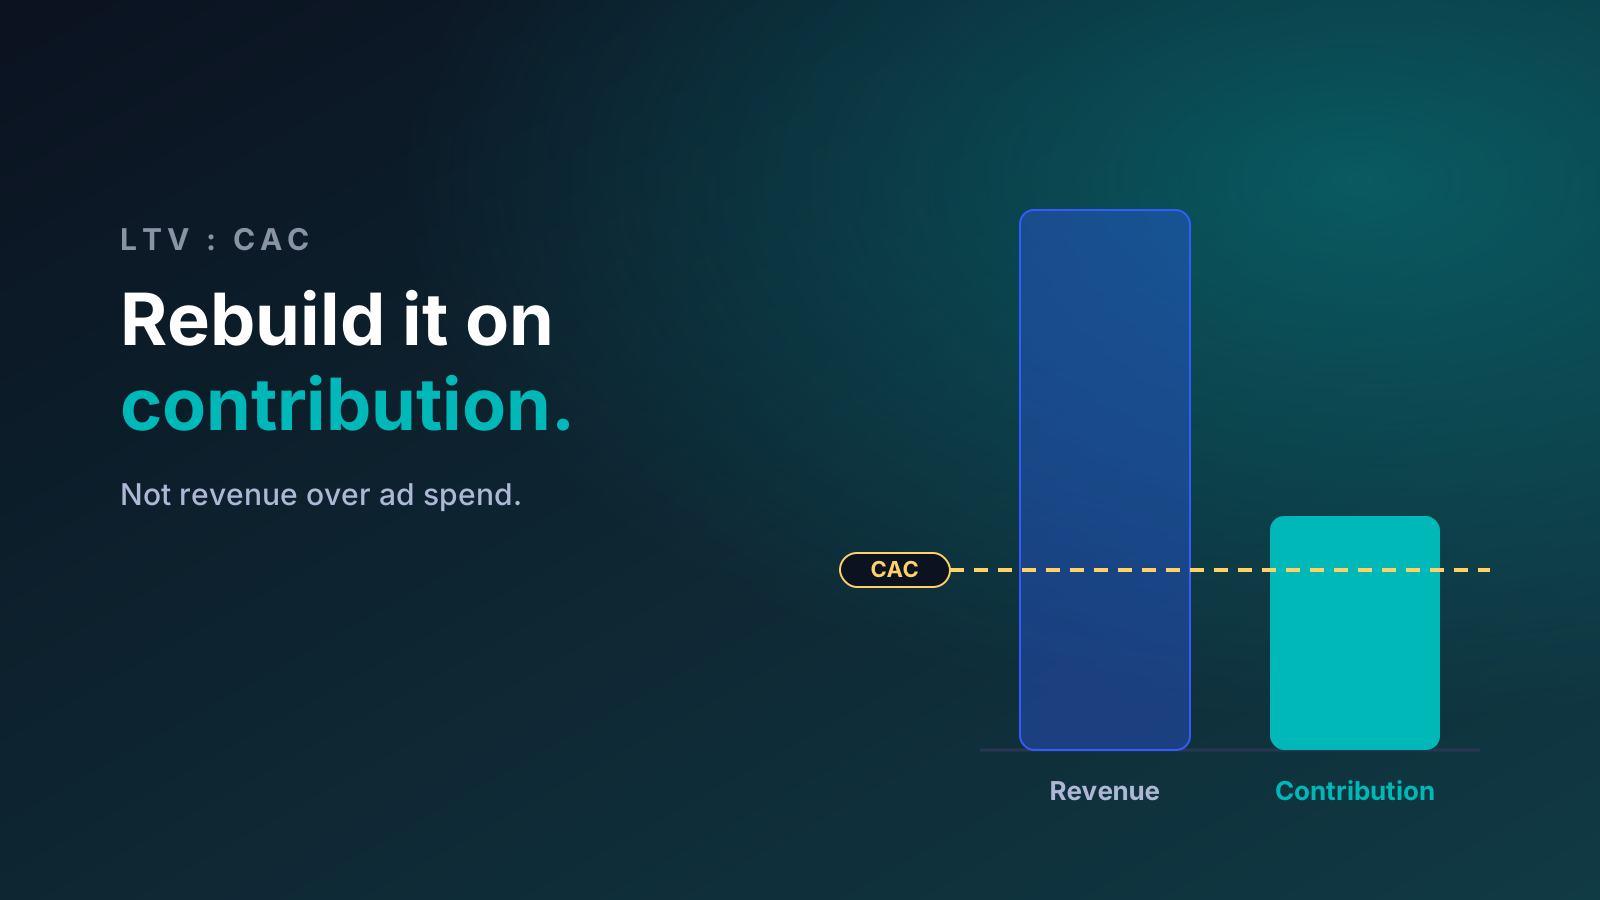
When a founder tells me their LTV to CAC ratio is 3:1, my first question is what sits on top of the fraction. Most of the time it is revenue: average order value times expected orders, divided by what the brand spent on ads. That number is real. It just isn't the one that pays for the next customer.
Revenue LTV over CAC is ROAS with a longer window. It flatters every brand with thin margins, heavy shipping or a lot of discounting, and it can't answer the question a growth plan actually needs answered: how much can we pay for a new customer and still be fine on cash?
Work LTV out on contribution, after product cost, shipping, fees and returns, by cohort. Then turn it into an allowable CAC: the most you can pay for a new customer and get the money back within the payback window your cash and inventory can carry. The ratio is a summary. The ceiling is the decision.
Investors get there too. As I wrote in the data room checklist, show an LTV number and expect to be asked whether it is contribution or just revenue. It is a better meeting when the contribution version already exists.
Why the 3:1 rule breaks for a consumer brand
The 3:1 rule of thumb comes out of subscription software, where gross margins are high and a customer who stays costs little extra to serve. On revenue, 3:1 there means most of the top of the fraction is margin. Put the same 3:1 on a skincare or coffee brand, where a large share of every order goes to product, pick and pack, shipping and payment fees, and much of the top of the fraction was never the brand's to spend.
Two brands can both show 3:1 on revenue and be running completely different businesses. One keeps, say, 60% of each order after variable costs and is comfortably funding its growth. The other keeps 30% and is buying customers at a loss that later orders won't close. The ratio can't tell them apart. Contribution can.
The ratio also hides time. A 3:1 that arrives in month 30 and a 3:1 that arrives in month 6 are the same ratio and very different cash plans. For a brand that pays for inventory months before it sells it, time is the part that hurts.
Contribution margin per order: what comes out
Start with one order, not one customer. Net revenue, after discounts, minus everything that only happens because that order happened: landed product cost, pick and pack, shipping, payment and platform fees, and an allowance for returns and refunds. What is left is contribution before marketing. It is the same build as the channel tab in the investor-ready financial model, one step before the acquisition cost comes off.
Do it by product line, or at least by first product. One blended margin can hide a line that cannot afford any acquisition spend at all.
Keep the definitions straight. If discounts already reduced net revenue, don't subtract them a second time. Leave the team, rent and software out of it. They matter a great deal, but they get paid from what is left after marketing, not order by order.
Contribution LTV by cohort, and which window to trust
Next, group customers by the month of their first order and track cumulative contribution per customer for each month the cohort has been alive. Cohorts rather than one average across the whole customer file, because customers acquired in a big promotion behave differently from the ones who paid full price in March, and an average mixes them together.
The window matters more than the formula. I would rather work with what the cohorts have actually shown than with a three-year projection built from six months of data. If the brand has twelve months of clean cohorts, I use twelve-month contribution per customer. If it has six, I use six and say so. A projection has its place in a model; the acquisition budget runs on what customers have already done.
Replenishment and subscription products tend to build contribution LTV quickly and visibly. A one-time purchase, a mattress or a big piece of equipment, may not repeat often enough for later orders to carry the first. For those brands the honest LTV sits close to the first order, and the plan has to work on that.
When there is enough volume, split cohorts by first product and by channel as well. Customers who arrive through a deep discount and customers who arrive through a referral don't necessarily come back at the same rate, and one average will hide the difference.
From LTV to allowable CAC: payback and cash, not a ratio
This is the part the ratio skips. Allowable CAC is the most you can pay for a new customer and still get the money back, on contribution, within the window the business can wait. That window is a cash decision before it is a marketing one. Cash in the bank, inventory commitments, repeat behaviour and the EBITDA plan all pull on it, which is why I agree it with finance before I agree any budget.
Some brands need first orders to be profitable, because there is no runway to wait or no repeat behaviour to wait for. Their allowable CAC is first-order contribution. Others can fund acquisition from later contribution, six months out or twelve. Same customers, different ceilings.
A worked example, every number hypothetical. Take the $26 order above and a cohort that has placed 1.3 orders per customer by month six and 1.6 by month twelve.
| What the business can wait for | Contribution per customer in the window | Allowable CAC |
|---|---|---|
| First order has to pay back | 1.0 × $26 | $26.00 |
| Six-month payback | 1.3 × $26 | $33.80 |
| Twelve-month payback | 1.6 × $26 | $41.60 |
| For comparison: 3:1 on revenue LTV | 1.6 × $60 ÷ 3 | $32.00 |
Say the account is buying new customers at $35. The revenue view reads 2.7:1, a little light, so trim spend a bit. The contribution view says something more useful: $35 is inside a twelve-month payback and outside a six-month one. Whether that is fine depends on which of those the business can carry, and that is a question for the cash plan, not the ad account. The revenue rule's $32 isn't wrong because it is too high or too low. It is answering a question nobody in finance asked.
The ceiling is not a target. A cohort that pays back its CAC exactly at the end of the window has paid for itself and nothing else. The team, the rent, the software and the profit come out of the gap between what you actually pay for a customer and the ceiling. That gap is the number I watch.
Which CAC goes on the bottom of the fraction
The CAC in the ratio should be new-customer CAC: acquisition spend divided by new customers, not by all orders. Divide by all orders and returning customers make acquisition look cheaper than it is, while their contribution is already counted in the LTV. Count them twice and the ratio gets flattering in a hurry.
My main read is blended new-customer CAC, total acquisition spend across channels against total new customers. Channel-level CAC is useful for steering, read as a consistent trajectory under one attribution method, but no single view is the truth, and channels that lift each other show up incompletely in each platform's own reporting. The incrementality post covers how I check what a channel actually adds, and the post on ad spend as a % of net revenue covers the ratio I put next to this one.
Decide once what counts as acquisition spend and write it down: media, and whether agency fees, creator fees and product seeding go in. Different answers are defensible. Changing the answer between months isn't.
Marketplaces: an Amazon customer is a different number
Once a brand sells on Amazon or another marketplace, contribution per order changes. The marketplace's selling and fulfilment fees come off, and so does the ad spend inside the platform. The repeat side changes too. A marketplace shows you far less about who came back than your own store does, so contribution LTV there is usually an estimate, built from whatever repeat data the platform reports, and it should be labelled as one.
I keep marketplace and own-store LTV separate rather than averaging them into one figure. I would also expect some of the demand that ads create on one channel to convert on the other, which is one more reason the blended numbers carry more weight than any channel view. The two-way door framework covers how I think about adding a marketplace in the first place.
How I read it week to week
Contribution LTV moves slowly. It is a monthly or quarterly read, refreshed as each cohort ages. The weekly check is simpler: is blended new-customer CAC inside the ceiling we agreed, is new-customer volume holding, and is marketing spend as a share of net revenue where finance expects it. Those sit near the top of the weekly business review.
When the inputs move, the ceiling moves. A price increase, a new shipping rate, a heavier discount calendar (the Black Friday post shows how one sitewide offer can quietly cut contribution) or a shift in which product brings customers in all change it. I would rather update the ceiling than defend last year's.
What I would tell a CEO
Stop reporting LTV:CAC on revenue. Build contribution per order by product line, cohorts by first-order month, and agree with finance how long the business can wait for payback. That gives you a ceiling on what to pay for a customer, and a gap between the ceiling and what you pay today. The gap is the plan. Putting that build together with a brand's finance lead is a big part of the growth advisory work on our services page.
What would change my mind about a window: cohorts that keep buying for longer than the window assumes, with the data to show it. Then the window can stretch. Not before.