 DirectToGrowth Co.
When investors push back on a consumer brand's deck, they are almost never pushing back on the deck. They are asking about the model underneath it. Where does this margin come from? What does retention look like by cohort? What happens to cash in Q4?
If the model cannot answer in under a minute, the deck does not matter. I learned that the hard way, six versions in.
Build the model first. The deck is just a set of views into it.
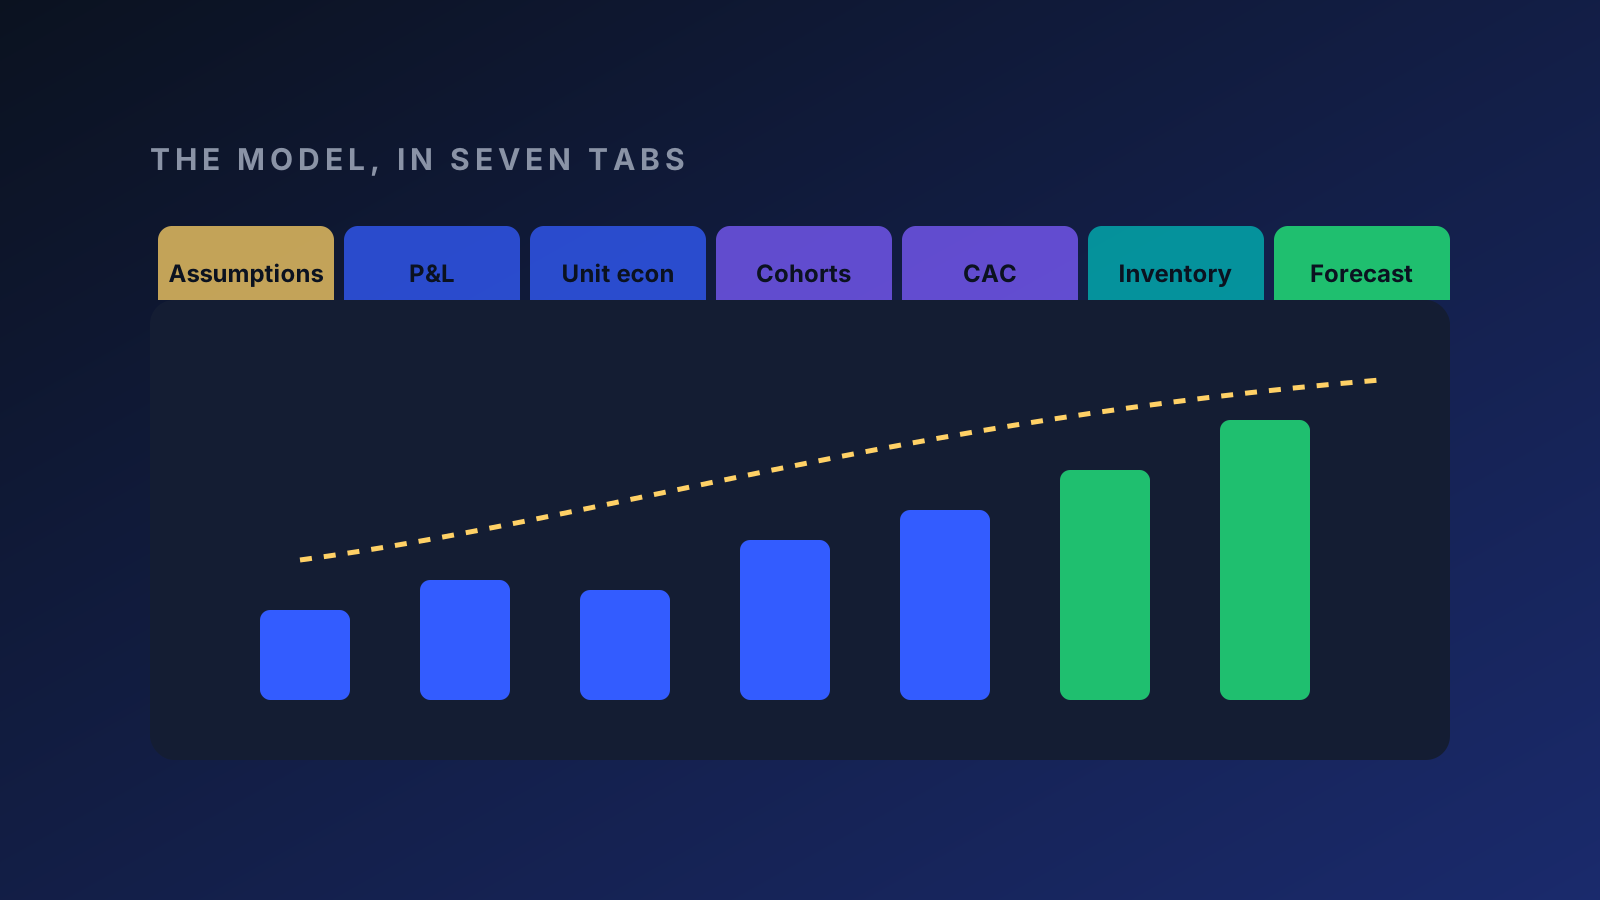
This is the structure I use. Seven tabs, nothing exotic. Each one earns its place by answering a question investors ask in the first two meetings, and most of them are the questions I ask in the first month of an engagement anyway: is marketing spend tagged correctly on the P&L, what does each order contribute, and how long can the business wait to get its acquisition cost back.
1. Assumptions
Every assumption on its own row, with its source and the date it was last checked. Conversion rate, average order value, repeat rate, CAC by channel, COGS per unit, retail velocity, price changes. Inputs in one colour, formulas in another. If an investor wants to stress-test the upside, they should be able to change one cell and watch it flow through.
2. Monthly P&L by channel
Your own site, marketplaces, retail, wholesale, international. Monthly, not quarterly, because seasonality hides in quarters. Gross revenue, discounts, returns, net revenue and gross margin by channel. Define gross and net once, at the top, and never drift. Tag marketing spend to the channel it bought as well; whether that has been done is the first thing I check on a new client's P&L.
3. Unit economics per order
The tab that answers "does each order make money?" For an average order on each channel: net revenue, minus product cost, shipping, fulfillment and payment fees, minus the marketing spent to get it. That is contribution margin. I would rather see it honestly negative on first orders and positive by the second than a blended number that hides both. The question underneath the tab is the gap between what a customer costs to acquire and what they contribute over twelve months after product, shipping and fulfillment, and how long the business can stomach waiting for that payback: six months, or twelve. Inventory, cash and the monthly EBITDA target all pull on that answer, which is why I agree it with finance before I agree anything with marketing.
| Line | Own site | Marketplace | Retail |
|---|---|---|---|
| Net revenue per order | ✓ | ✓ | per unit to retailer |
| Product cost (landed) | ✓ | ✓ | ✓ |
| Shipping + fulfillment | ✓ | marketplace fees | freight to DC |
| Payment + platform fees | ✓ | ✓ | trade spend + deductions |
| Acquisition cost | CAC | ad spend / orders | promo + field |
| Contribution margin | ✓ | ✓ | ✓ |
4. Cohorts
Customers grouped by the month of their first order, with repeat rate and cumulative revenue per customer for every month after. For a subscription brand this is usually the proving chart, the one you are actually raising on. Build it from raw order data, not from a dashboard, so you can show your work in the data room.
5. Acquisition
Spend, new customers and CAC by channel by month, plus payback period. Use one attribution method, write it down, and stick to it. Add a blended view, total marketing as a share of net revenue and blended new-customer CAC, total spend against total net-new customers. Investors trust the blended numbers more than any platform's, and so do I, because they are the one view no attribution model can argue with.
6. Inventory and working capital
The tab software templates do not have and consumer brands cannot live without. Units on hand and on order by SKU. Purchase orders with their payment dates. Supplier and retail payment terms. The seasonal build. This is where you find out your real runway, and it is where investors look to see whether growth will eat your cash.
7. Forecast and cash
Twenty-four months, monthly, with two cases. Base is the plan you expect to be held to. Upside is what the money buys, built bottom-up from growth engines, retail doors, subscription, a new market, so each one ties to a line on the use of funds slide. End with a monthly cash balance for both. If the upside runs out of cash before it pays back, you have found your raise size.
The rules that make it investor-ready
- History first. Actuals for as many months as the data is clean, then the forecast. Investors anchor on the trend.
- One source of truth. Deck charts, data room tables and the scorecard all pull from the model. Nothing is typed twice.
- Every assumption is visible. No hard-coded numbers buried in formulas.
- Reconcile before it leaves. Revenue in the P&L matches the accounting system, month by month.
- Bottom-up beats top-down. "1% of a huge market" is not a forecast. Doors × velocity × price is.
Where AI helps, and where it doesn't
I use AI heavily to clean exports, build cohort tables, check formulas and keep the deck in sync with the model. It is fast and it does not get bored. It does not decide what a number should be. Every assumption gets checked by a person, with the same gates I use for my weekly business review.
A good model does not predict the future. It shows investors exactly what you would have to believe, and lets them change it.
FAQ
What should a financial model for investors include?
An assumptions tab, a monthly P&L by channel, unit economics per order, customer cohorts, acquisition cost and new customers by channel, inventory and working capital, and a forecast with base and upside cases plus a monthly cash view.
How many years should a startup financial model forecast?
Monthly for at least 24 months forward, with history going back as far as the data is clean. Years three to five can be annual, and I treat them as directional.
What is contribution margin for a D2C brand?
Revenue after discounts and returns, minus product cost, shipping, fulfillment, payment fees and the marketing spent to acquire the order. It is the clearest measure of whether each order makes money, and the number I check first on a new P&L.
Should the pitch deck numbers come from the financial model?
Yes. Every chart and figure in the deck should pull from a specific tab in the model, so the deck, the data room and the model always agree.